
|
CSN & IMPROVE Protocol Assessments: How It Works |
Overview
Goals of the assessment:
Network background:
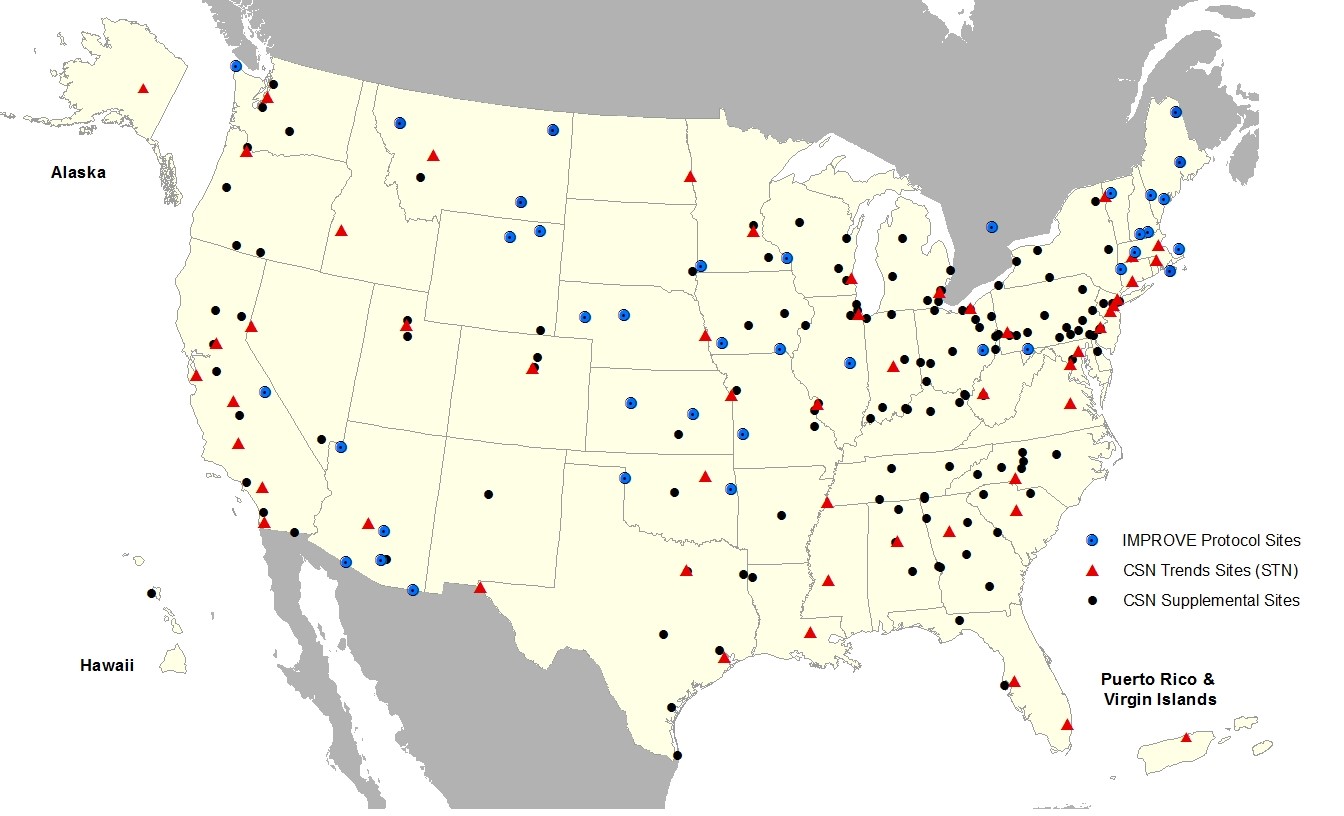
Prior to the network assessments, the CSN Network consisted of 227 sites. The breakdown is as follows:| Using CSN National Contract Lab for Shipping & Analysis | Evaluated in 2014 CSN Assessment | Using Independent Labs for Shipping & Analysis | Using IMPROVE National Contract Lab for Shipping & Analysis | Evaluated in 2015 IMPROVE Protocol Assessment | |
| 52 STN Sites | X | X | |||
| 122 Supplemental Sites | X | X | |||
| 15 Supplmental Sites* | X | ||||
| 38 IMPROVE Protocal Sites | X | X |
*At the time of the assessments, EPA was aware of 15 Supplemental CSN sites that chose not to use EPA's or IMPROVE's national contract for shipping, handling and laboratory analysis. These sites were not considered in either assessment process.
CSN Network (click for full size)
Approach
An objectives based approach was taken in an effort to optimize the network to meet the primary objectives, which include support of PM2.5 implementation, aiding in interpretation of health effects and exposure research studies, and the detection of trends.
We were aware that the CSN data are used for many secondary objectives (e.g., urban increment, source attribution, etc.). However, only the primary objectives were used as the basis for the assessment.
A two-step decision-making process was utilized to make recommendations regarding the continued funding of shipping and analysis at the 174 CSN sites using EPA's national contract and the 38 IMPROVE Protocol sites using IMPROVE's national contract. The additional 15 CSN sites using independent laboratories were not considered in the assessment process.
Scoring
Step 1: Primary Objectives Scoring
Sites were evaluated and provided points according to the table below for meeting the primary objectives of the network.
| Parameter | |
|---|---|
| NCore Site | |
| Annual DV for site: > 12 μg/m3 | |
| 24-hr DV for site: > 35 μg/m3 | |
| STN Site | |
| Annual DV for county > 12μg/m3 (site <=12μg/m3) | |
| 24-hr DV for county > 35μg/m3 (site <=35μg/m3) | |
| Collocated with a PM2.5 Daily FRM monitor | |
| Health effects/exposure city of interest | |
| Continuous monitor(s) (i.e., OC/EC, sulfate) | |
| Collocated* with: | |
| IMPROVE | |
| NATTS | |
| PAMS | |
*Although collocation did not meet a "primary objective", it did meet an assessment goal of leveraging with existing networks
Results:Decision Matrix
Step 2: Decision Matrix for 102 Sites
A matrix was created using the scoring outlined in the table below to further determine funding recommendations for the 102 sites identified in Step 1. Positive points were applied for parameters that added value. Negative points were applied for parameters that did not add value.
| Parameter | |||
|---|---|---|---|
| Annual DV (if applicable) | |||
| 24-hr DV (if applicable) | |||
| Population | |||
| County Emission Rank | |||
| Nearest Speciation Site (CSN or IMPROVE) | |||
| Statistically significant increase in trend concentration | |||
| Increased model bias or error if site removedC | |||
| Correlation with major species at the nearest 5 speciation (CSN or IMPROVE) sitesE | |||
| Nearest 5 speciation (CSN or IMPROVE) sites | |||
| Nearest CSN Site | |||
A Pollutants considered using 2011 NEI Emissions: PM2.5, SO4, NO3, OC, EC, VOCs and SO2.
B Pollutants considered (>75% records above MDL and overall average precision <10% for 2010-2012): PM2.5, SO4, NO3,
OC, EC, NH4, Fe, S, K, Ca, Na, Si, Cu, Br and Zn.
C Only evaluated in the 2014 CSN assessment due to staff availability.
D Pollutants considered: PM2.5, SO4, NO3, total carbon and NH4.
E Major species considered: PM2.5, SO4, NO3, OC, EC and NH4 (when applicable). The IMPROVE Protocol sites do not measure NH4, and the scoring was adjusted to account for this (5 major species worth 0.2 points per site in the 2014 CSN Assessment and 4 major species worth 0.25 points per site in the 2015 IMPROVE Protocol Assessment.)
Results: