
 Print Page
| Beth Landis, Joann Rice, Lewis Weinstock and Tim Hanley - EPA OAQPS | |
| Adam Reff, Neil Frank and Liz Naess - EPA OAQPS | |
| Tesh Rao - EPA OAQPS |  |
| Jim Kelly - EPA OAQPS | |
| Beth Palma - EPA OAQPS | |
| Beth Hassett-Sipple - EPA ORD | |
| Alan VanArsdale - EPA Region 1 | |
| Daniel Garver - EPA Region 4 | |
| Rich Poirot - NACAA | |
Frequently Asked Questions
- What was the CSN Assessment?
The CSN Assessment was an assessment of the Chemical Speciation Network that took place in 2014 to create an optimized network that meets primary monitoring objectives and can also be financially sustained.
- What was the IMPROVE Protocol Assessment?
The IMPROVE Protocol Assessment was an assessment of the IMPROVE Protocol sites that took place in 2015. These sites are considered CSN supplemental sites where the monitoring agencies chose to operate them as IMPROVE sites when the CSN was established. These sites were excluded from the 2014 CSN Assessment because it only considered sites utilizing the CSN national contract laboratory for shipping, handling and analysis. In 2015, it was determined that these sites should also be assessed using the same objectives based approach and nearly identical evaluation criteria as the CSN assessment.
- Why were assessments necessary?
Assessments were performed to ensure that a key national monitoring network was designed and operated in a manner to reflect current air quality issues and to address the CSN budget shortfall that was due to increasing contract laboratory and shipping costs.
- What changes were considered in the assessments to reduce costs?
Several options were considered in an effort to address the budget shortfall. These included reducing the sample frequency across the network to 1-in-6 days, defunding sites, reducing the number of icepacks included in sample shipments, reducing the carbon blank frequency, eliminating the CSN PM2.5 mass measurement, and reducing the number of elements reported in the network.
- What were the differences between the CSN Assessment and the IMPROVE Protocol Assessment?
The CSN and the IMPROVE Protocol Assessments used the same objectives based approach, and nearly identical scoring criteria. Due to the fact that NH4 is not collected at the IMPROVE Protocol sites, it was not included in the correlation with major species scoring in the decision matrix. For this reason, the 5 applicable "major species" were worth 0.2 points in the CSN Assessment, and the 4 applicable "major species" were worth 0.25 points in the IMPROVE Protocol Assessment. Also, the IMPROVE Protocol Assessment did not evaluate model bias and error should a site be removed due to staffing availability. Rather, we relied on feedback from stakeholders to raise this concern should they feel the site was necessary for modeling purposes.
- What changes were implemented as a result of the assessments and when?
The following changes were implemented as a result of the assessment:
- CSN PM2.5 mass measurement was eliminated at sites collocated with an FRM in October, 2014.
- 38 CSN sites were defunded and monitoring discontinued by February 2015.
- 3 CSN sites reduced sample frequency in February 2015.
- The number of icepacks included in CSN shipments was reduced during cooler months (October-March) beginning October 2014. This will continue on an annual basis.
- Carbon backup filter blanks in the CSN were eliminated in January 2014 and carbon field blanks in the CSN were reduced to once a month at 26 representative 1-in-3 day sites and 23 representative 1-in-6 day sites in February 2015.
- 8 IMPROVE Protocol sites were defunded and monitoring discontinued by January 2016.
- Rather than defunding sites, why wasn't the sample frequency reduced to 1-in-6 across the network?
Sample frequency was not reduced across the network because it was determined that a reduction in sample frequency from 1-in-3 to 1-in-6 results in an increase in uncertainty in the annual mean. Also, the Code of Federal Regulations Title 40 Part 58.12 requires NCore and STN sites to operate on at least a 1-in-3 day sampling frequency.
- How has the size of the network changed as a result of the assessment?
In early 2014, the CSN consisted of 174 sites utilizing the national contract laboratory, 38 IMPROVE Protocol sites and approximately 15 other sites using various state and local laboratories. As of January 2016, the CSN consists of 136 sites utilizing the national contract laboratory, 30 IMPROVE Protocol sites, and the approximately 15 other sites remain. Of the 136 CSN sites using the CSN national contract, 4 were recommended for defunding but the monitoring agency chose to continue operations using other funds.
- What happens to CSN monitoring equipment at sites that have been defunded?
It is the discretion of the state or local monitoring agency. Agencies responsible for multiple CSN sites may benefit from having spare instrumentation on hand to replace equipment needing repair. The equipment can also be used in special studies or shared with other agencies in need.
- What happens to IMPROVE Protocol monitoring equipment at sites that have been defunded?
The maintenance crew associated with the IMPROVE program removes the equipment so it can be used as necessary to support the remaining program.
- Why are the majority of the defunded sites located on the east coast?
The majority of the sites are located on the east coast because that is where the highest density of sites were located. The sites on the east coast had a greater chance of correlating well for the primary PM2.5 constituents with a nearby site because of this higher density.
- Were low concentration and/or regional background sites targeted?
No, low concentration and/or regional background sites were not "targeted" for defunding. However, the IMPROVE network is typically relied on for providing concentrations at rural, background sites. During the feedback process, sites that were recommended for defunding that were identified by stakeholders as providing valuable information (e.g., background sites being used to inform SIPs in neighboring non-attainment areas) was taken into consideration before any network changes were implemented. Prior to the CSN Assessment, 28 sites had a 2010-2012 annual design value less than 8 μg/m3. After the CSN Assessment, 25 of these 28 sites remain.
- In the past, I used the CSN PM2.5 mass measurement to validate any unusual FRM mass measurements at my site. Now that I no longer have CSN mass, how can I validate unusual FRM mass measurements.
The CSN species data can be used to validate unusual FRM mass measurements by comparing the sum of species to the FRM mass measurement. Sum of species being the sum of all measured elements, ions, and organic and elemental carbon species. Optionally, mass could be reconstructed using the measured species and reconstructed mass can be compared to the FRM mass measurement, historical FRM mass measurements and/or mass measurements from nearby continuous monitors to determine whether the FRM value is an outlier. Reconstructed mass can be calculated as follows:
Reconstructed mass = soil + ammonium nitrate + ammonium sulfate + 1.6*OC + EC
Soil = 2.2(Al) + 2.42(Fe) + 1.63(Ca) + 2.49(Si) + 1.94(Ti)
Ammonium nitrate = 1.29 * nitrate
Ammonium sulfate = 4.125 * elemental sulfur
- How can I validate my CSN species data without a CSN mass value or on a day when my FRM mass data were not available?
CSN species data can be validated by comparing the sum of species or reconstructed mass to historical sum of species and mass measurements at the particular site. Historical trends for individual species should also be used to help identify outliers. In addition, nearby continuous or FRM monitors can provide the ability to ground-truth measurements on the occasion that FRM data is not available at a particular site.
- A site scored less than 2 points in the decision matrix but was ultimately funded. Why?
While the primary objectives and decision matrix scoring took many parameters into consideration, we were aware that other important uses of the chemical speciation data for sites could have been missed. For this reason, feedback was requested from EPA headquarters, regional staff, state and local monitoring agencies, researchers, academics and communities before making any changes to the network. As a result of these "intangibles" and feedback, 31 CSN and IMPROVE Protocol sites continued to receive funding due to various reasons that otherwise would have been defunded based solely on scoring. Some examples of intangibles/feedback that could cause a site to continue to receive funding include those located in an environmental justice area, data being used in an active SIP, and/or located in a potential nonattainment area.
- What happened to the funds that were saved?
The funds that were saved have been used to address the budget shortfall. Any additional funds available will be used to reinvest in the network. After the CSN shipping, handling, and laboratory analysis contracts award in September 2015, the final cost to support the network is being determined, and decisions regarding reinvestments are forthcoming.
- What types of reinvestments are being considered?
There are many reinvestments that have been discussed, including daily speciation and continuous measurements in select areas, new measurements and measurement technologies, equipment upgrade and replacement and new sites in areas with emerging air quality issues. It is important to note that savings available for reinvestment are still being determined following the CSN shipping, handling, and analysis contract awards and recalculations of the cost of the network. Also, it is important to note that savings available for reinvestment will decrease annually as laboratory contract costs continue to increase.
- Will the IMPROVE network be doing a similar assessment?
Yes, the IMPROVE Steering Committee will be evaluating the IMPROVE network to determine what changes need to be made to create and maintain a financially sustainable network going forward.
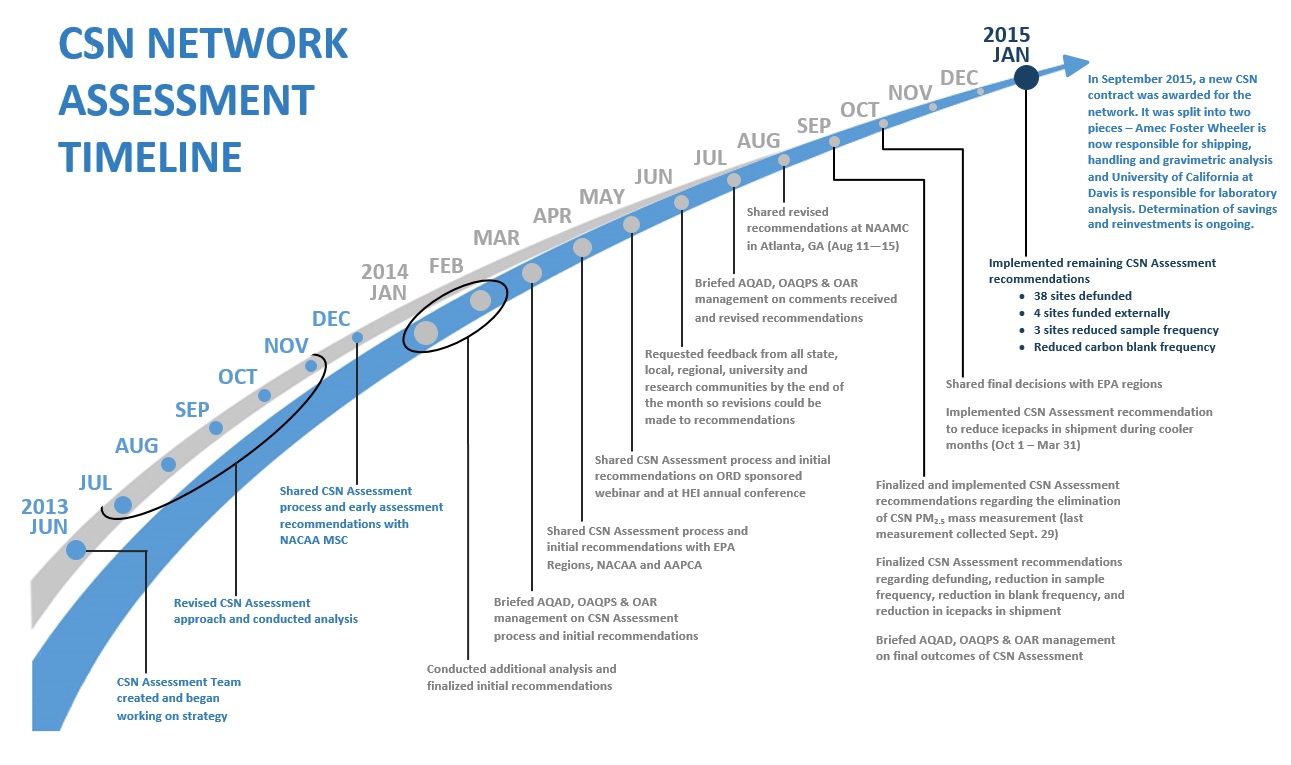
Assessment Timelines
Chemical Speciation Network Assessment Timeline
(Click for full size)
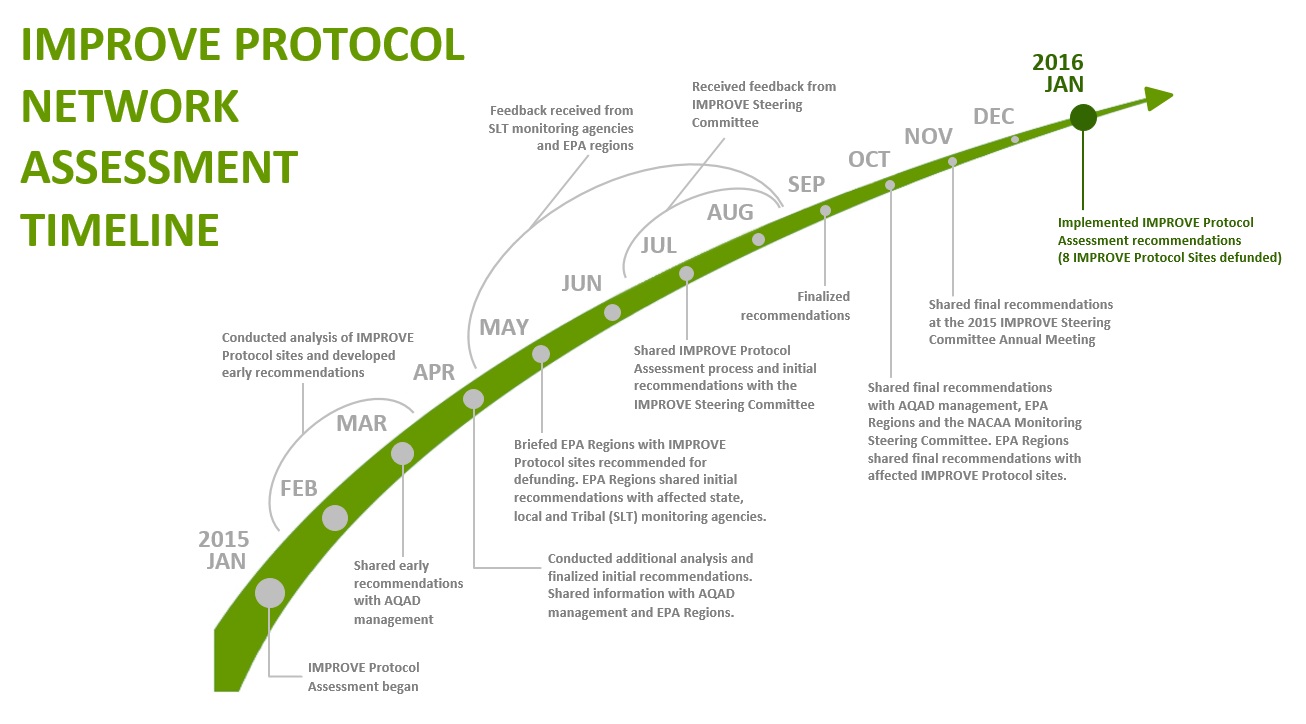
IMPROVE Protocol Assessment Timeline
(Click for full size)
Acronyms
- AAPCA - Association of Air Pollution Control Agencies
- AQAD - Air Quality Assessment Division
- Br - Bromine
- Ca - Calcium
- CSN - Chemical Speciation Network
- Cu - Copper
- DV - Design value
- EC - Elemental Carbon
- EPA - Environmental Protection Agency
- Fe - Iron
- FEM - Federal Equivalent Method
- FRM - Federal Reference Method
- HEI - Health Effects Institute
- IMPROVE - Interagency Monitoring of Protected Visual Environments
- K - Potassium
- MDL - Minimum detection limit
- MSC - Monitoring Steering Committee
- Na - Sodium
- NACAA - National Association of Clean Air Agencies
- NATTS - National Air Toxics Trends Station
- NCore - National Core Multipollutant Monitoring Stations
- NEI - National Emissions Inventory
- NH4 - Ammonium
- NO3 - Nitrate
- OAQPS - Office of Air Quality Planning and Standards
- OAR - Office of Air and Radiation
- OC - Organic Carbon
- ORD - Office of Research and Development
- PAMS - Photochemical Assessment Monitoring Stations
- PM2.5 - Particulate matter with a diameter of 2.5 micrometers or less
- S - Sulfur
- Si - Silicon
- SIP - State Implementation Plan
- SLT - State, Local, and Tribal
- SO2 - Sulfur Dioxide
- SO4 - Sulfate
- STN - Speciation Trends Network
- VOCs - Volatile Organic Compounds
- Zn - Zinc
Acknowledgements
The following people were involved with the analysis and helped determine recommendations.
CSN Assessment Team: